
20.2. Performance Monitoring#
Before you optimize a job, you need to know how it is actually running: whether the GPUs are busy, how much memory it uses, and where the time goes. This page is about watching a job and diagnosing its bottleneck. It follows a simple loop: monitor, diagnose, optimize. Once you know the bottleneck, apply the fixes in ML Efficiency, and for a deep dive into any single step use the profilers in GPU Profiling.
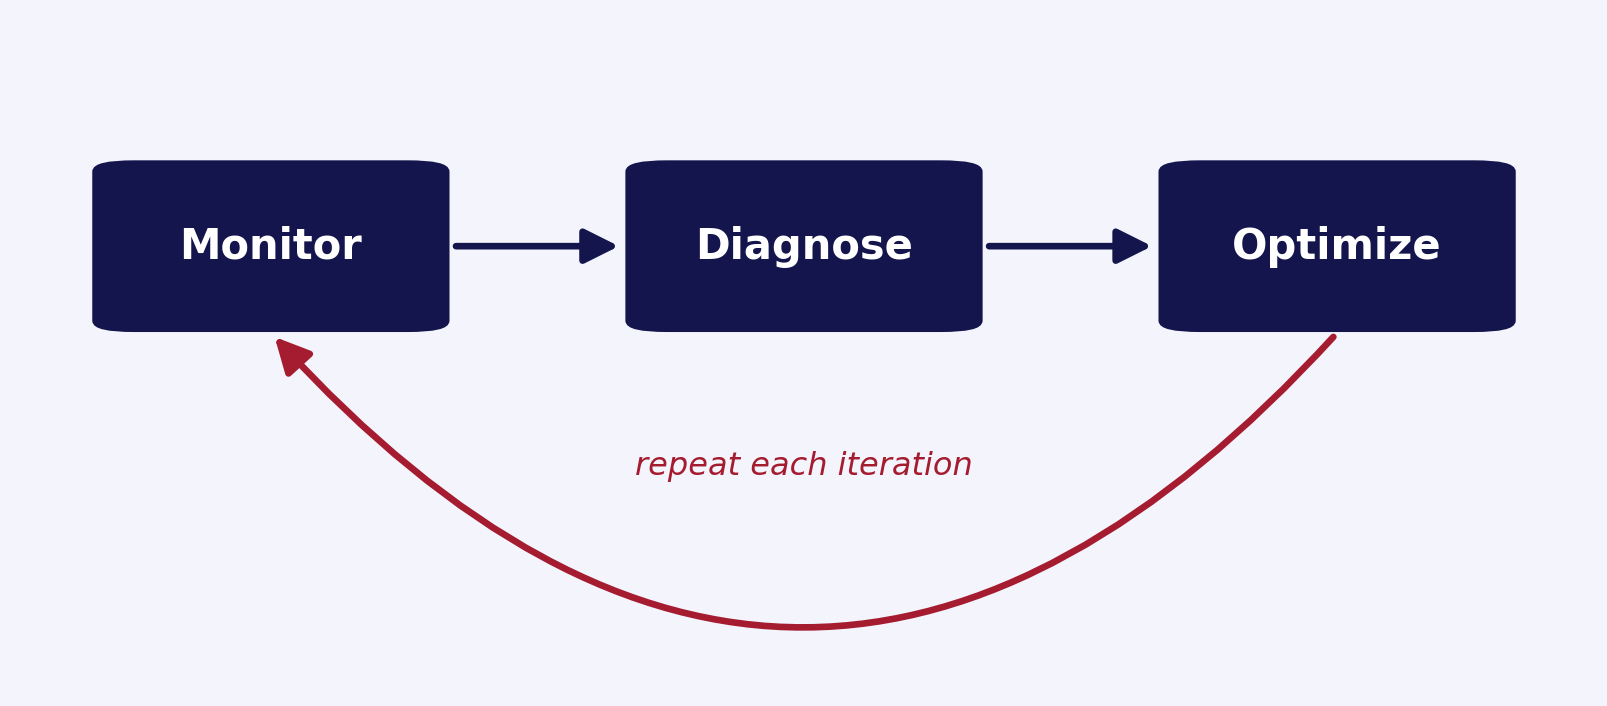
Fig. 20.1 The performance loop: monitor how a job runs, diagnose the limiting resource, apply a fix, and repeat.#
20.2.1. Monitor a running job#
Several tools show what a job is doing, from a quick glance to detailed counters.
KempnerPulse (recommended for GPUs). The Kempner Institute’s KempnerPulse dashboard reads NVIDIA Data Center GPU Manager (DCGM) hardware counters and shows real streaming multiprocessor (SM), tensor-core, and memory activity per GPU, with SLURM awareness. It is the most honest quick view of whether your GPUs are doing useful work. See KempnerPulse.
KempnerInsight (web dashboard). KempnerInsight is a Kempner Institute web application that brings together a wide range of job-level and cluster-level metrics in one place, so you can review how your jobs and the cluster are performing from a browser.
nvidia-smi and nvtop. On the compute node running your job (not the login node), nvidia-smi gives a quick snapshot of memory use and power. A compact query form is:
nvidia-smi --query-gpu=name,utilization.gpu,memory.used,memory.total,power.draw --format=csv
Warning
Do not read the nvidia-smi or nvtop “GPU utilization” percentage as a measure of efficiency. It only reports the fraction of time at least one kernel was running on the GPU, not how much of the GPU’s compute you use, so it can show 100% even when a single small kernel is running and real throughput is a few percent. Use KempnerPulse (DCGM counters) or Model FLOPs Utilization for the true picture.
SLURM, while the job runs. Use squeue -u $USER to see your jobs and their nodes. For live resource use, jobstats <jobid> (described below) is the most reliable option and also reports GPU activity.
The lower-level sstat can report a running step directly, but only for batch (sbatch) jobs and only against a specific step, such as the .batch step:
sstat -j <jobid>.batch --format=JobID,MaxRSS,AveCPU
Warning
sstat prints only the header row, with no values, if you pass the top-level job ID (<jobid> without a step), an interactive (salloc) job that has no .batch step, or a step that has not started yet. For a reliable live view, use jobstats or KempnerPulse instead.
SLURM, after the job ends. seff summarizes CPU and memory efficiency, and sacct reports detailed accounting:
seff <jobid>
sacct -j <jobid> --format=JobID,JobName,Elapsed,MaxRSS,ReqTRES%40,State
FASRC jobstats. FASRC also provides jobstats, which gives a fuller picture than seff: it reports CPU utilization, CPU and GPU memory, and GPU utilization per node, for both running and completed jobs (longer than one minute).
jobstats <jobid>
FASRC also offers a browser-based Single Job Stats Dashboard, where you enter a job ID to see its profile (this requires the FASRC VPN; the link is on the jobstats page). Adding --mail-type=END to your submission script includes the jobstats summary in the completion email.
JobScope. The Kempner Institute’s JobScope turns Slurm, NVIDIA DCGM, and NVML data into a clean CPU and GPU efficiency report for your completed jobs over a chosen time window. Install it with uv tool install jobscope, then run:
jobscope --cgpu -D 3 # CPU and GPU efficiency of your jobs over the last 3 days
Note
seff reports CPU and memory efficiency but not GPU utilization, so a low “CPU Efficiency” is normal for a GPU job. Use it to catch over-requested memory and cores, and use jobstats, KempnerPulse, or profiling to judge GPU use. In sacct, MaxRSS (peak memory) is recorded per step, so it appears on the .batch and other step rows rather than the top-level job row. For more on SLURM accounting, see Understanding SLURM.
20.2.2. The metrics that matter#
A few numbers tell you whether the hardware is well used. Some you calculate or log yourself, and some you read directly from a monitoring tool.
You calculate or log these:
Model FLOPs Utilization (MFU): your model’s achieved FLOPs per second divided by the GPU’s peak. It is the headline efficiency metric for large training runs and far more meaningful than the
nvidia-smiutilization percentage, but you compute it yourself, and what counts as a good value depends heavily on the model.Throughput: the work done per second, in whatever unit fits your model, such as samples, images, or steps per second (or tokens per second for language models). Log it every step as the most direct measure of progress.
You observe these directly, for example in KempnerPulse (from DCGM counters):
SM active and SM occupancy: how much of the time the streaming multiprocessors (SMs) are engaged, and how fully they are filled with warps. Low values point to a compute pipeline that is starved or poorly parallelized.
Tensor-core and memory activity: whether the tensor cores and memory system are actually being used, which shows whether mixed precision and the data path are paying off.
Memory footprint: peak GPU memory versus what the GPU has. Headroom means you can grow the batch; running near the limit risks out-of-memory errors.
Power draw: a rough proxy for how hard the GPU is working.
Tip
Log throughput and memory every run so you can compare experiments and catch regressions. Weights & Biases records these over time, and system metrics automatically.
20.2.3. Find the bottleneck#
If a run is slower than expected, decide which resource is limiting it before changing anything.
GPU-bound (GPUs busy with real compute): the good case. To go faster, make the compute itself cheaper. See ML Efficiency.
Data-bound (GPUs waiting on input): utilization dips between steps and CPU or disk is busy. Tune the input pipeline. See Parallel I/O.
Communication-bound (multi-GPU runs stalling on synchronization): time lost in collective operations. See Distributed GPU Computing.
Tip
A fast test for a data bottleneck: if replacing your dataset with random tensors of the same shape speeds the run up noticeably, the input pipeline, not the model, is the limit.
20.2.4. Profile for detail#
When the quick tools are not enough, profile the run to see individual operations and kernels. The PyTorch Profiler, Holistic Trace Analysis, and NVIDIA Nsight tools, with worked examples, are covered in GPU Profiling.
For memory specifically, PyTorch reports allocator statistics and can capture a snapshot for debugging out-of-memory errors:
import torch

print(f"peak GPU memory: {torch.cuda.max_memory_allocated() / 1e9:.2f} GB")
print(torch.cuda.memory_summary())        # detailed allocator breakdown

# Record a snapshot to inspect what holds memory
torch.cuda.memory._record_memory_history()
# ... run the step that runs out of memory ...
torch.cuda.memory._dump_snapshot("mem_snapshot.pickle")
Note
PyTorch’s caching allocator keeps freed memory to reuse it, so reserved memory can stay high and the stats can look surprising, especially when the sequence length varies between batches. Read the peak allocated value as your true footprint, and compare runs at the same shapes.
See also
Drag the snapshot file onto the interactive viewer at pytorch.org/memory_viz to see exactly what allocated the memory. See the CUDA memory reference for the statistics functions and the memory snapshot docs for the snapshot workflow.
20.2.5. Act on findings#
Monitoring only pays off when it changes what you do. Common findings and where to fix them:
What you see |
Likely cause |
Where to fix |
|---|---|---|
Low MFU, GPUs busy |
Small batch, unfused ops, no mixed precision |
|
Utilization dips between steps |
Data loading cannot keep up |
|
Out-of-memory errors |
Model or batch too large for the GPU |
ML Efficiency (checkpointing, accumulation, sharding, lower precision) |
Multi-GPU run scales poorly |
Communication overhead |
|
Over-requested memory or cores ( |
Allocation larger than needed |
Right-size the job; see Cluster Usage Policies |