
1.5. KempnerInsight Cluster Monitoring App#
KempnerInsight is a web dashboard, built by the Kempner Institute, for monitoring the Kempner AI cluster from a browser. It gathers job-level and cluster-level metrics in one place, so you can check how your jobs and the cluster are performing without running command-line tools. This page walks through what each part of the app shows. For command-line and GPU-counter tools, see Performance Monitoring and Optimization.
1.5.1. Accessing KempnerInsight#
Open kempnerinsight.eng.kempnerinstitute.harvard.edu in a browser. The app has three tabs, covered in order below: Job, Cluster, and Report.
1.5.2. Monitoring your jobs#
The Job tab lists jobs running on the cluster in a searchable, sortable table. Filter by user, partition, state, or date range to find your own jobs, and sort by any column, for example by duration or GPU count.
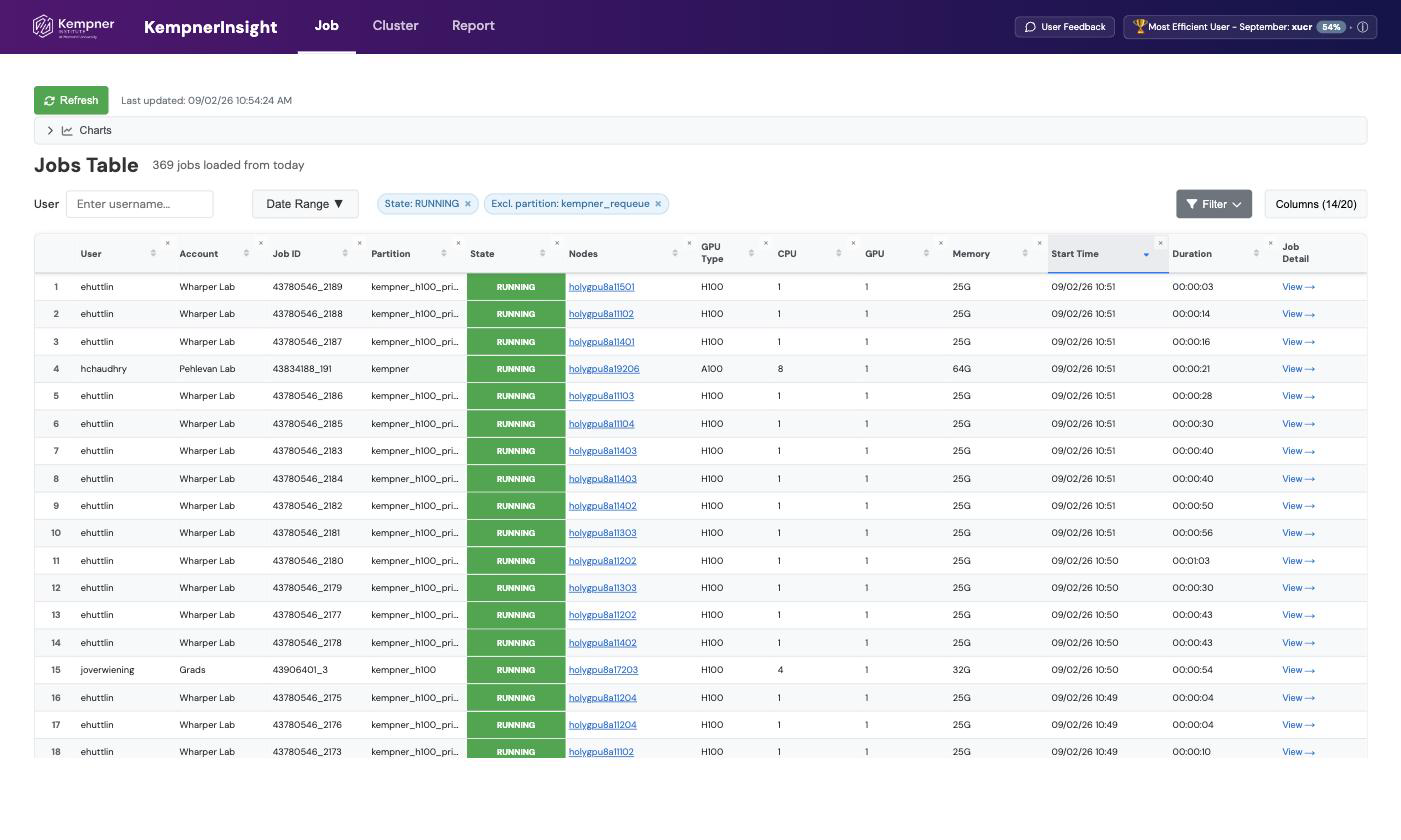
Fig. 1.4 The Jobs Table on the Job tab. Each row is a job, with its user, account, partition, node, GPU type and count, memory, timing, and a link to its detail view.#
Expanding the Charts panel above the table shows aggregate views of the job queue: how long jobs have been waiting by GPU request size, why jobs are waiting, and GPU allocation against the cluster’s total capacity.
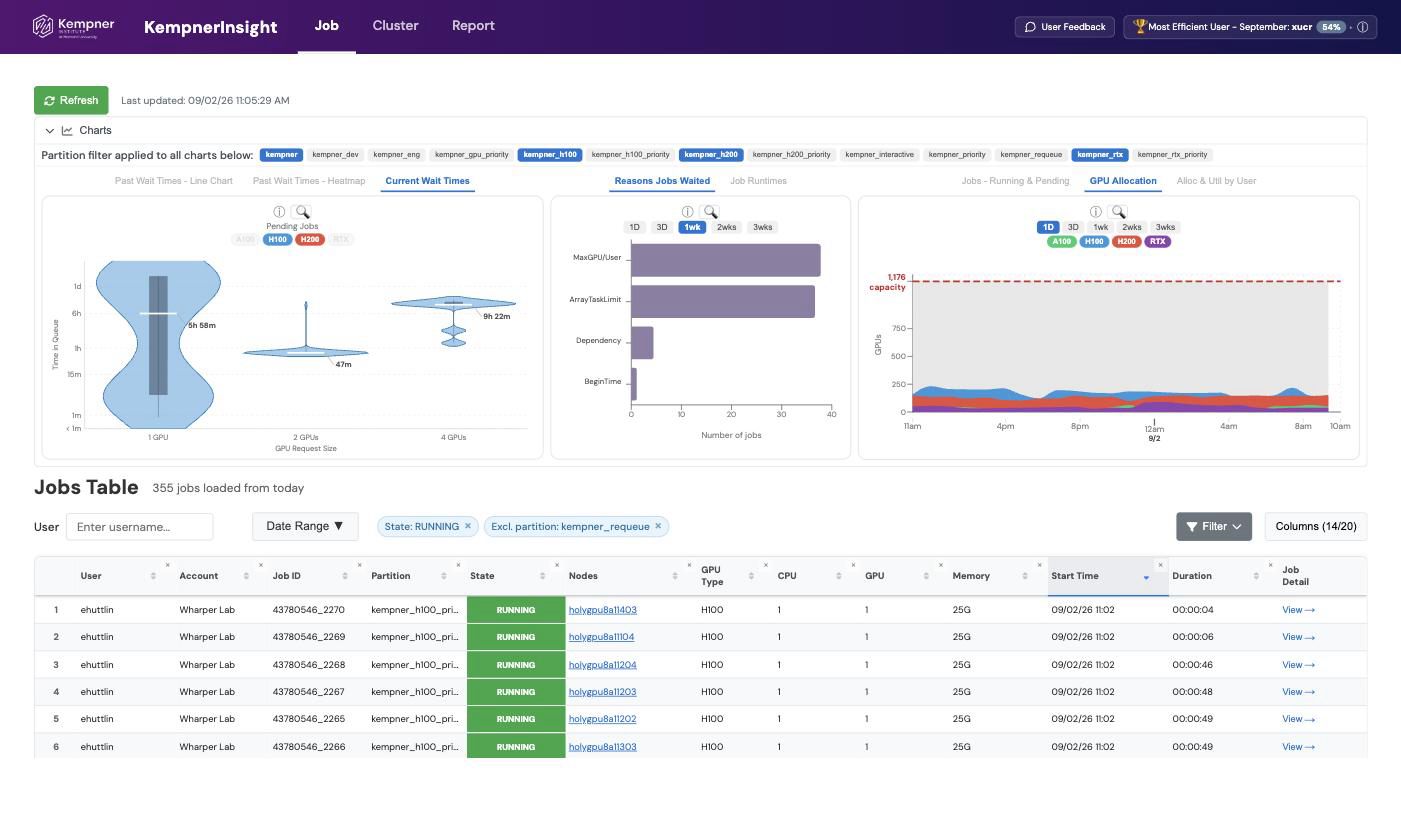
Fig. 1.5 The Charts panel on the Job tab, showing current wait times, reasons jobs waited, and GPU allocation over time.#
Selecting a job’s View link opens its detail view. The Summary Info section restates the job’s allocation, and donut charts show its average CPU and memory utilization against what it requested.
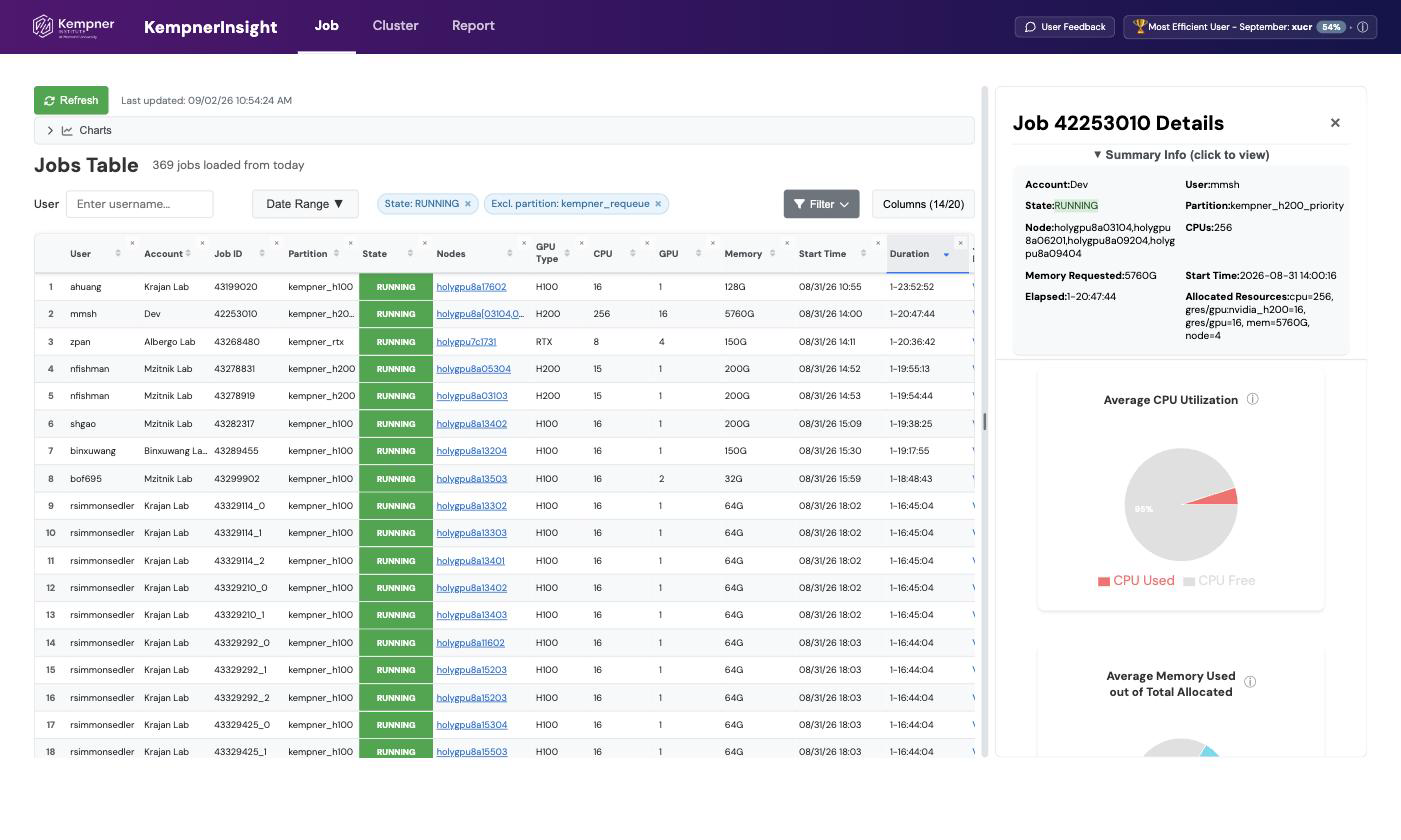
Fig. 1.6 A job’s detail view, with its summary and average CPU and memory utilization.#
Below the summary, the detail view plots per-GPU utilization over time, one panel per node, for both compute and memory. These plots are the clearest way to tell whether a job is actually using the GPUs it holds: a job that reserves GPUs but leaves them near zero is wasting the allocation.
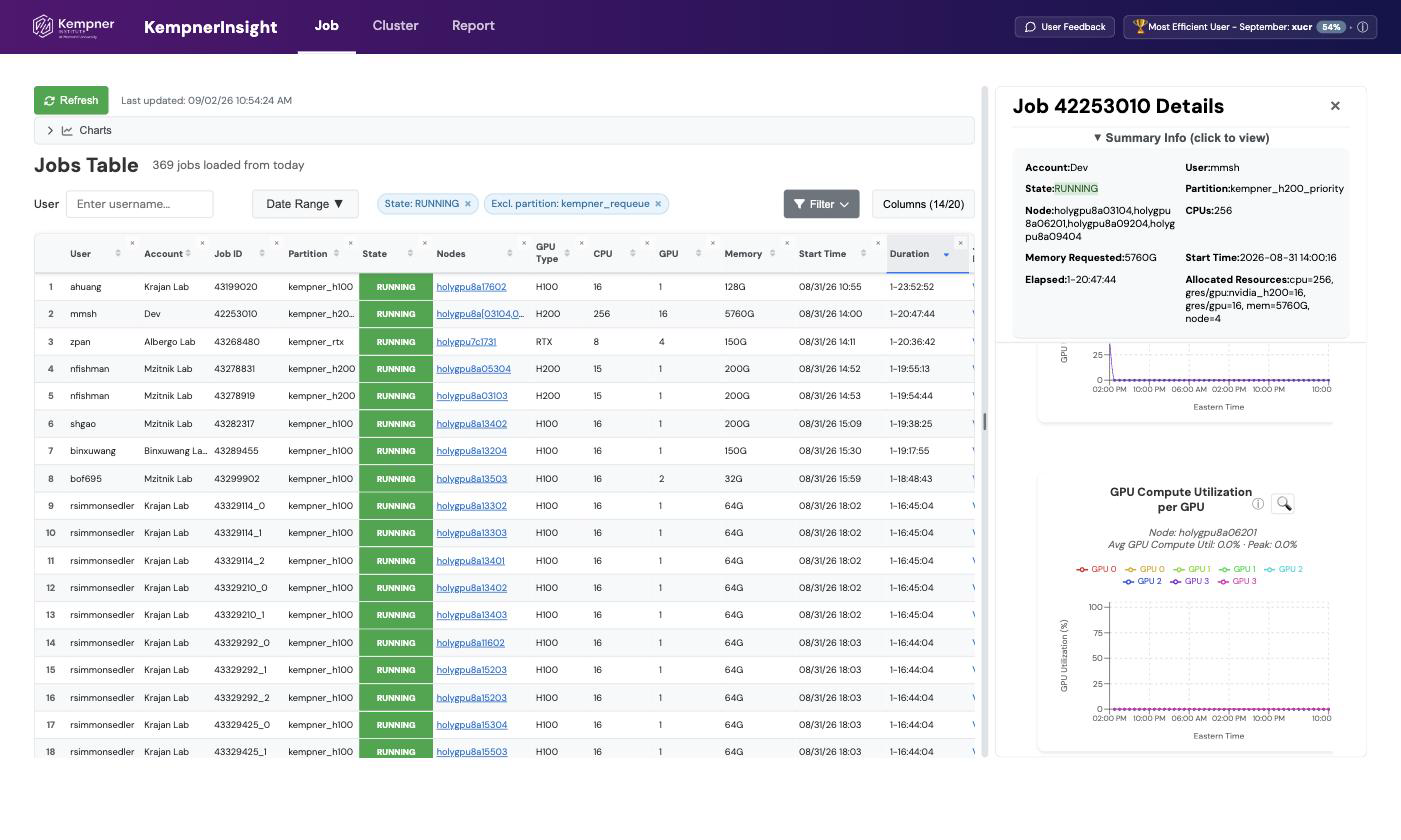
Fig. 1.7 Per-GPU compute utilization over time for one node of a job, with average and peak values. Flat, low lines indicate GPUs that are held but idle.#
The detail view also plots InfiniBand throughput for each node the job runs on, showing the inbound and outbound traffic over the node’s InfiniBand interfaces, averaged across its RDMA devices. This is the node’s total traffic on the InfiniBand fabric, which for distributed jobs includes communication between nodes as well as high-speed data access.
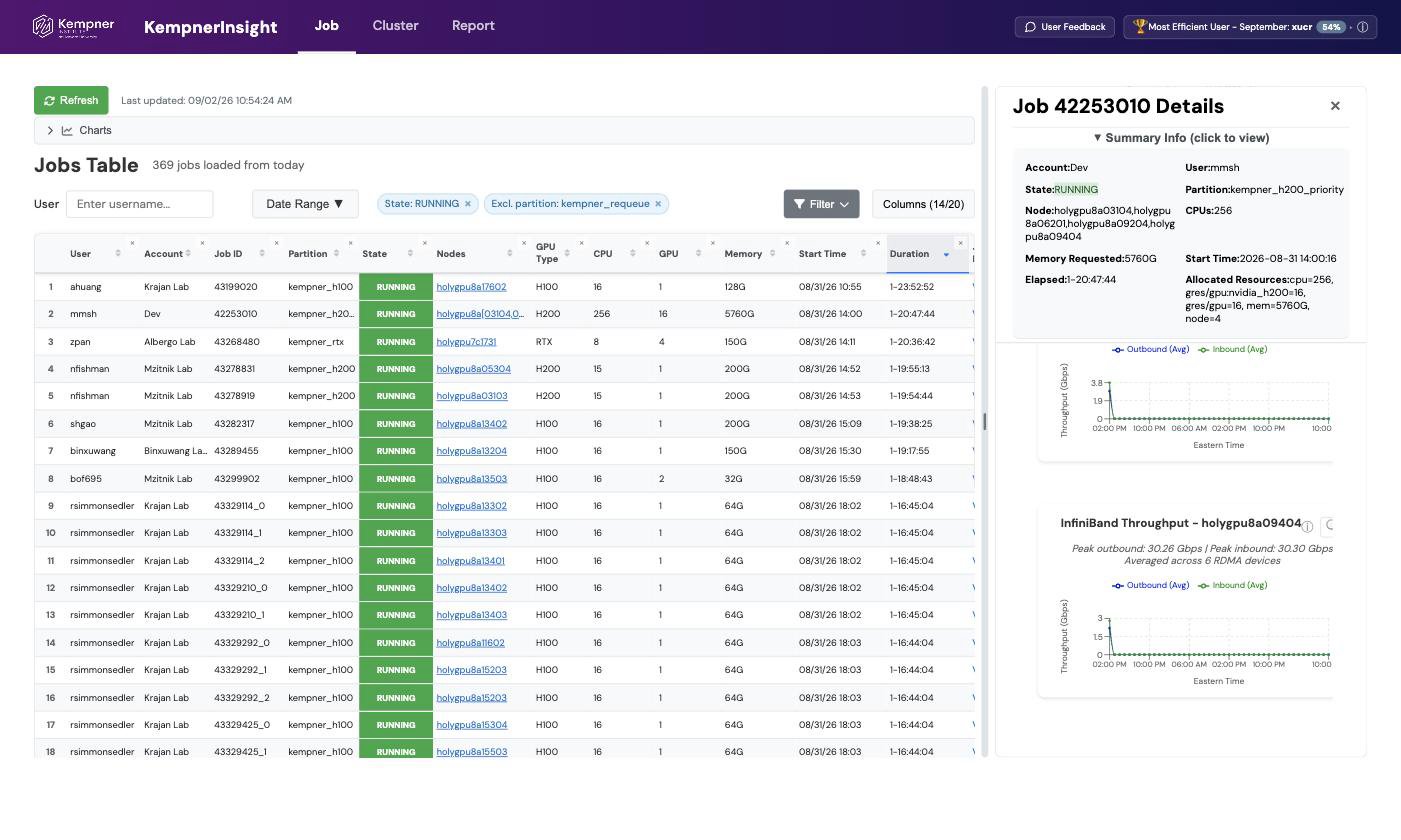
Fig. 1.8 InfiniBand throughput for one of a job’s nodes, showing outbound and inbound traffic averaged across the node’s RDMA devices.#
1.5.3. Monitoring the cluster#
The Cluster tab shows the state of the whole cluster. A GPU status heatmap colors every GPU by how heavily it is used, from idle to fully utilized, alongside counts of allocated, free, and down GPUs. Charts track allocation and real utilization over time against the cluster’s compute capacity, and summarize node states and how GPUs are shared across labs.
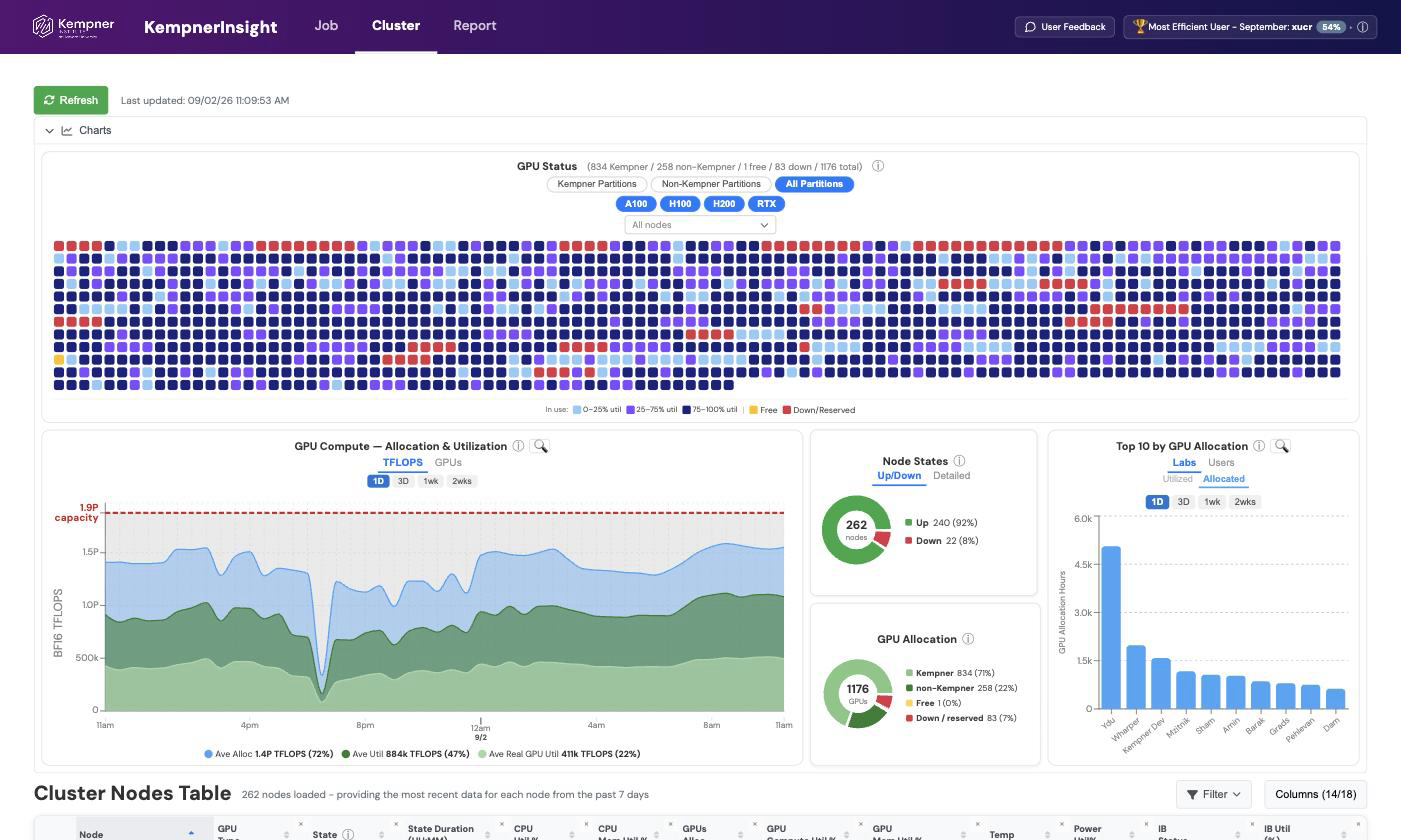
Fig. 1.9 The Cluster tab: a per-GPU status heatmap, allocation and utilization over time, node states, and the top labs by GPU allocation.#
A per-node table below the charts reports each node’s GPU type, allocation, CPU and GPU utilization, memory, temperature, power utilization, and InfiniBand status.
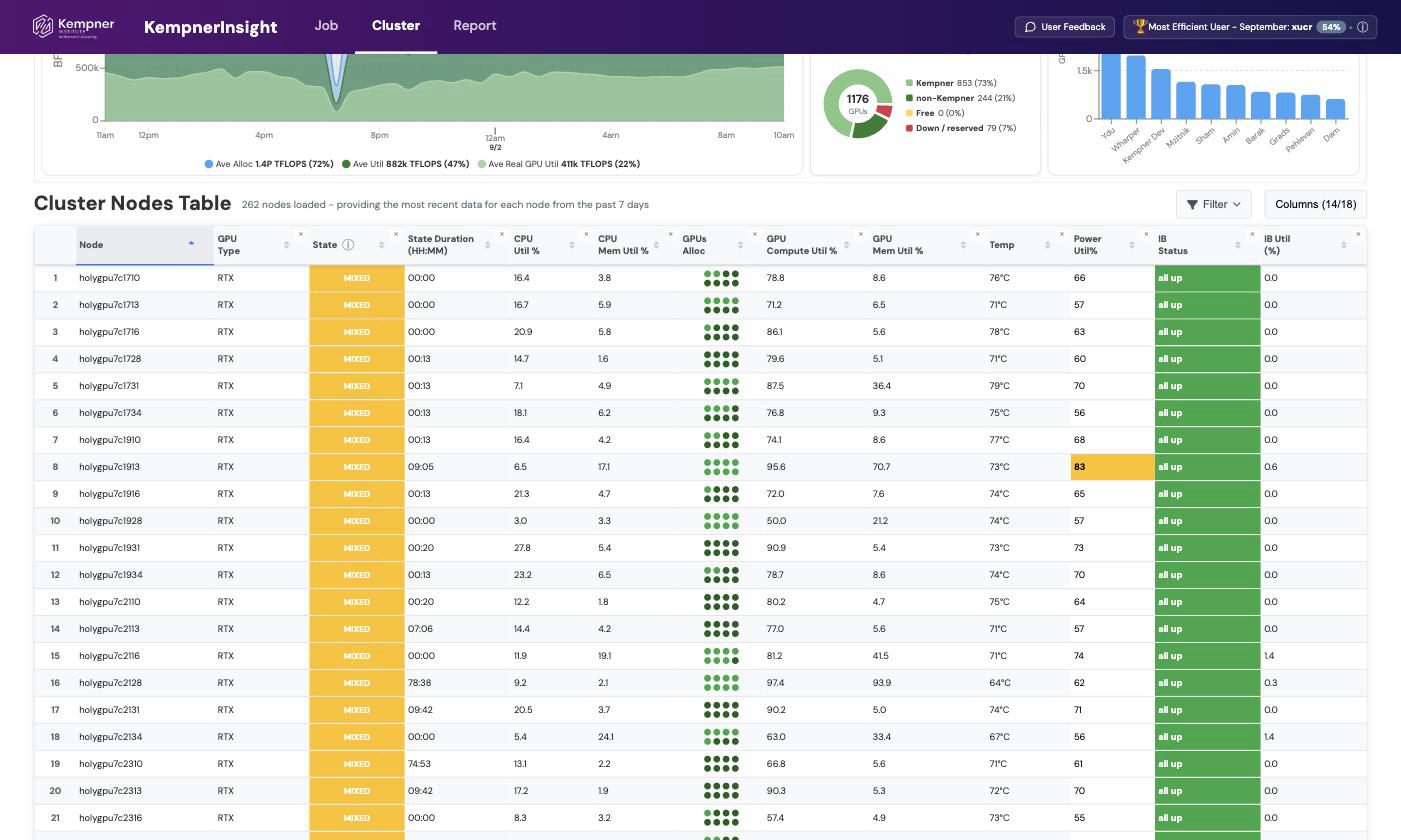
Fig. 1.10 The Cluster Nodes Table, with per-node utilization, temperature, power, and InfiniBand status.#
1.5.4. Usage reports#
The Report tab generates a usage summary for a lab, a set of labs, or the whole cluster over a date range. It reports total GPU hours, an equivalent cloud cost, job and user counts, average utilization, and how usage breaks down by user and GPU type. Reports can be downloaded.
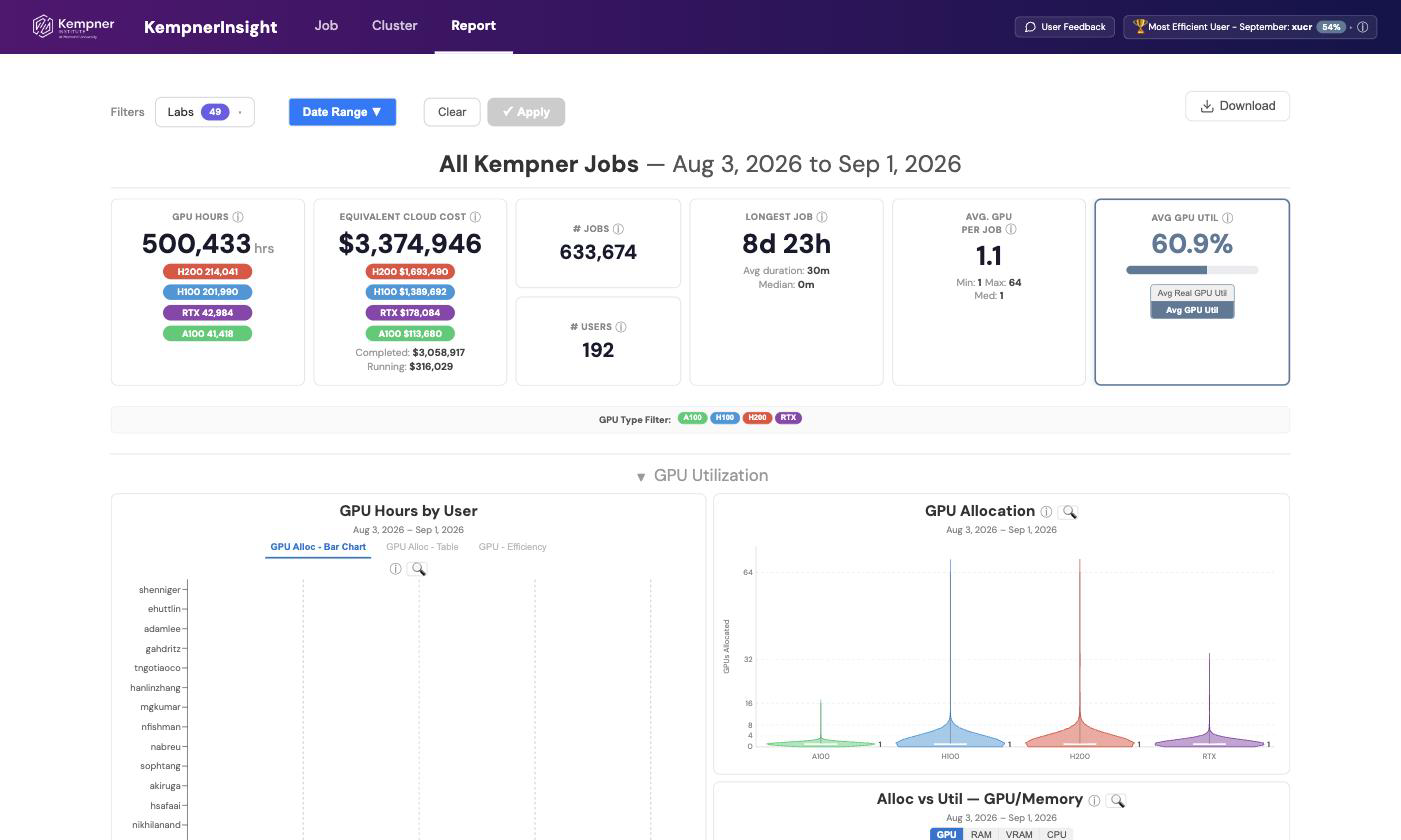
Fig. 1.11 A usage report for all Kempner jobs over a month, with GPU hours, equivalent cloud cost, job and user counts, and average GPU utilization.#
See also
For command-line monitoring and GPU-counter tools such as jobstats and KempnerPulse, see Performance Monitoring and Optimization. For the GPU types referenced throughout the app, see GPU Types and Use Cases.